Redis, Valkey, and Dragonfly benchmarks: read the method first
A benchmark number without its method sounds complete, but it does not tell you what happened.
The first note in this series, Redis, Valkey, or Dragonfly: revisit the choice before you treat them as the same cache, covered licences, history, data file compatibility, and cluster mode. This note takes the published performance claims of all three projects and writes the machine, the version, and the client settings next to each figure. Where a page is silent, this note says so. Revisit.Tech ran no tests for this post. Every figure below is the vendor’s own run, from the vendor’s own site or repository.
The short version
- Dragonfly’s “25X” line compares one Dragonfly process with one Redis process on a 64 vCPU machine. The README does not state the Redis version or the Dragonfly version used.
- Redis answered in June 2022 with a 40-shard Redis 7.0 Cluster on the same machine type, and reported Redis ahead. That too was a vendor run, against a competitor.
- Redis 8.x and Valkey 8.x both now publish I/O thread gains. Most of the Redis 8 throughput figures do not state the CPU model, the client tool, or the connection count.
- Valkey 8.0’s headline of about 1.2 million requests per second appears with three different instance descriptions across three of its own posts.
- None of these numbers can be placed side by side. A fair comparison has to be run by you, on one machine type, with your key sizes, and with persistence and replication switched on.
What to look for in any benchmark claim
Before reading the figures, keep this checklist open. A claim is only as good as the answers.
- Who ran it, and do they sell one of the products?
- Exact server version, and the date of the run.
- Server machine: instance type, vCPU count, CPU architecture, kernel.
- Server threads:
io-threadsfor Redis and Valkey,proactor_threadsfor Dragonfly, or the number of shards. - Client tool, client machine, and whether the client was on a separate host.
- Threads and connections from the client.
- Pipeline depth. A pipeline of 1 means one request at a time per connection.
- Value size and key count.
- Read and write ratio.
- Persistence and replication: on or off.
- Which latency percentiles were reported, and at what load.
Most published runs answer about half. That is usually launch writing, not bad faith. It still means the figure is not a fact about your system.
Dragonfly’s own numbers
The README and the 25X line
The Dragonfly README states that Dragonfly delivers “25X more throughput” compared to “legacy in-memory datastores.” The detail sits further down the same file.
- Small instance: on an AWS
m5.large, client on a separatec5nin the same zone,memtier_benchmark -c 20 --test-time 100 -t 4 -d 256. SETs: Redis 159K QPS, Dragonfly 173K. GETs: Redis 194K, Dragonfly 191K. - Slightly larger: on
m5.xlargewith-t 6. SETs: Redis 190K, Dragonfly 279K. GETs: Redis 220K, Dragonfly 305K. - The 25X figure: on
c6gn.16xlarge, “compared to a single Redis process,” crossing 3.8M QPS. Client was memtier on a separatec6gn.16xlarge, with-c 30 -n 200000 -d 256and threads “tuned per server and instance type.” - With
--pipeline=30, the README says 10M QPS for SET and 15M QPS for GET. - Memory: about 5GB loaded with
debug populate 5000000 key 1024, thenbgsaveunder update traffic. The README says Dragonfly was 30% more memory efficient at idle, and that Redis peaked at almost 3X Dragonfly’s memory during the snapshot.
Not stated: the Redis version, the Dragonfly version, the date of the run, whether Redis I/O threads were enabled, the exact memtier thread count for the 25X run, and the instance type for the memory test.
Read the m5.large result again. On the small instance the two servers are roughly level. The gap grows as cores are added, because one Redis process executes commands on one main thread. The 25X line measures that design choice on a 64 vCPU box. It is not a per-request speed difference.
The benchmark documentation page
Dragonfly’s benchmark page in its docs is more complete. As checked for this post (the page shows a last update of 10 August 2026), it records:
- Server: Dragonfly v1.15.0, released on 4 March 2024, run as
./dragonfly --logtostderr --dbfilename=. An emptydbfilenamemeans no snapshot file. Dragonfly used all vCPUs by default. - Server machine:
c6gn.12xlarge(48 vCPUs), thenc7gn.12xlarge(also 48 vCPUs). - Client:
memtier_benchmarkon ac7gn.16xlargewith 64 vCPUs, private IPs, same availability zone. Ubuntu 23.04, kernel 6.2. - Load:
-t 60 -c 20 -n 200000, so 1,200 connections. Pipelined runs used-c 5 --pipeline=10. - Results on
c6gn.12xlarge: writes about 4.2M ops/sec (p99 0.687 ms, p99.9 2.543 ms), reads about 4.1M (p99.9 0.903 ms), pipelined reads about 7.08M. - Results on
c7gn.12xlarge: 5.2M writes, 6M reads, 8.9M pipelined reads.
Not stated: value size and key count. The commands pass no -d, so memtier’s default applies. In the current memtier source that default is 32 bytes. Few production caches store only 32-byte values. Also not stated: number of repeat runs, and any replication.
The same page compares Microsoft’s Garnet on c6in.12xlarge and reports Garnet ahead on pipelined reads, 25.4M against Dragonfly’s 6.9M. A vendor publishing a result it did not win is worth noting.
Dragonfly against Valkey on Google Cloud
On 4 March 2025 Dragonfly published a test against Valkey on GCP.
- Versions: Dragonfly v1.26.1, Valkey 8.0.2 with
--io-threads 10 --save ''. - Machines: GCP C4 with 16, 32, and 48 vCPUs, kernel 6.8. The client ran on “a larger machine,” type not named.
- Client tool:
dfly_bench, Dragonfly’s own load generator, not memtier. - Workload: SET and GET at 1:1, 64-byte values, 200 million key range, 20 minutes. Client threads and connections were set per server. Dragonfly got 24 to 48 client threads. Valkey got 10 to 12. Parameters were chosen to keep p99 under 0.5 ms.
- Result: Dragonfly reports 2.4x Valkey’s throughput on 16 vCPUs and 4.5x on 48 vCPUs. On sorted sets with
ZADD, it reports 29x on 48 vCPUs, and 12.6 KiB against 23.1 KiB per sorted set entry.
Not stated: the client machine type and the number of runs. Note the timing too. Valkey 8.1, with its new hash table, was announced on 2 April 2025, four weeks after this run.
Redis’s numbers
The 2022 reply
On 28 June 2022 Redis published “13 Years Later, Does Redis Need a New Architecture?” Their argument was that Redis is meant to scale by running many processes, so the fair comparison is a Redis Cluster on the same box.
- Versions: Redis 7.0.0 built from source. Dragonfly built from source on 3 June 2022 at a named commit.
- Machines: client and server both
c6gn.16xlarge, 64 Arm cores, kernel 5.10, 126GB. - Redis setup: 40 primary shards on one VM, leaving 24 vCPUs idle. Two memtier processes in
--cluster-mode,-t 24 -c 1,-d 256, 1 million keys, 180 seconds. - Dragonfly setup:
-t 55 -c 30 -n 200000 -d 256. - Results reported: GET at pipeline 1, Redis 4.43M against Dragonfly 3.8M reproduced. GET at pipeline 30, 22.9M against 15.9M. SET at pipeline 1, 4.74M against 4M. SET at pipeline 30, 19.85M against 14M.
- Headline: Redis 18% to 40% higher throughput.
Not stated: persistence settings, and how a normal team would run and fail over 40 shards on one machine. Dragonfly’s 30 April 2025 open letter says it had not replied to that post until then. The letter offered a managed service price comparison instead, with a 6.5M RPS figure for Dragonfly Swarm measured at --pipeline 10, 32-byte values, reads only. That is a cloud pricing claim, not an engine benchmark.
Redis 8.0 to 8.4
Redis’s own figures for each release, from its blog and release notes:
- Redis 8.0 GA (1 May 2025): “up to 87%” lower command latency than Redis 7.2.5. The 8.0-M03 post explains the base: 149 tests, 90 improved, p50 reduction from 5.4% to 87.4%, median 16.7%.
- Redis 8.0 I/O threads: with
io-threadsset to 8 “on a multi-core Intel CPU,” 37% to 112% more throughput, depending on the command. Not stated: CPU model, core count, client tool, connections, pipeline, value size. - Redis 8.0 replication: a 10 GB full sync with 26.84 million writes during the sync. Primary write rate 7.5% higher (471.9K against 438.8K ops/sec), sync 18% faster (101 against 123 seconds), peak primary buffer 35% lower (15.16 against 23.24 GB). Machine not stated.
- Redis 8.2 GA (blog dated 8 August 2025): with 8 I/O threads, “up to 49%” more throughput than 8.0 at 20% writes and 80% reads, and over 1 million ops/sec on a single instance. Machine, client, and value size not stated. The same post claims 25% to 37% less memory for short string keys.
- Redis 8.4 (released 18 November 2025): the release notes say over 30% more throughput than 8.2 for 10% SET and 90% GET on 4 cores. The blog adds 1 KB string values. CPU model and client settings not stated.
Each of these compares Redis with an older Redis. Useful for an upgrade decision, silent on Valkey or Dragonfly.
Valkey’s numbers
8.0 and the 1.19 million figure
The two “Unlock 1 Million RPS” posts were written by AWS engineers, and part 1 says the work grew out of their ElastiCache and MemoryDB experience.
- 8.0-rc1 post (2 August 2024): up to 1.2 million QPS “on AWS’s r7g platform,” against a previous limit of 380K.
- Part 1 deep dive (5 August 2024): 360K to 1.19M requests per second against Valkey 7.2, average latency 1.792 ms down to 0.542 ms. 8 I/O threads, 3 million keys, 512-byte values, 650 clients, sequential SET, on a
C7g.16xlarge. - Part 2 (13 September 2024), the reproduction guide: a
c7g.4xlargewith 16 cores,--io-threads 9(main thread plus 8), saving disabled, network IRQs and the main thread pinned to chosen cores. Client from a separate instance:valkey-benchmark -t set -d 512 -r 3000000 -c 650 --threads 50.
So the same headline appears with r7g, C7g.16xlarge, and c7g.4xlarge. Treat the reproduction guide, the most specific of the three, as the method. Not stated: client instance type, and tail latency beyond the average. Note the manual IRQ and core pinning, which a default install will not do.
8.1, 9.0, and 9.1
- 8.0 memory (4 September 2024): 16-byte values, 6,318,941 keys, cluster mode.
used_memoryfell from 693.64 MB on 7.2 to 550.56 MB on 8.0, about 20.6%. One of the two changes is the per-slot dictionary, which applies to cluster mode. - 8.1 (2 April 2025): the new hash table saves roughly 20 bytes per key without TTL and up to 30 bytes with TTL. About 10% more throughput than 8.0 “for pipeline workloads when I/O threading is not used.” Machine not stated.
- 9.0 (deep dive dated 20 October 2025, release post 21 October 2025): over 1 billion requests per second across a 2,000-node cluster. Each shard had one primary and one replica, on
r7g.2xlarge(8 cores, 64 GB), withio-threads 6and saving disabled. Load came from 750c7g.16xlargeclient instances runningvalkey-benchmarkSET with 512-byte values. That is roughly 1 million per primary across 1,000 primaries. It is a cluster scaling result, not a single-node one. - 9.1 memory (13 August 2026): string key overhead down 17% to 44%, about 26% on average, measured with 5 million items per test, 9.0 against 9.1. This is overhead, not total memory.
Why these numbers do not line up
Even when every figure is honest, they answer different questions.
- Different machines. m5, c6gn, c7gn, c7g, r7g, and GCP C4 differ in cores, CPU generation, and network.
- Different shapes. Single process, one multi-threaded process, 40 shards on one box, and 2,000 nodes across many boxes are four different systems.
- Different thread settings. Each vendor tunes its own server well and the other server less well.
- Pipelining. Pipeline depth 10 or 30 can multiply throughput. Your application may send one request at a time.
- Value sizes. 32, 64, 256, 512, and 1,024 bytes all appear above. Memory, network, and copy costs change with size.
- Client saturation. If the load generator runs out of CPU first, you are measuring the client.
- Different clients. memtier, valkey-benchmark, and dfly_bench do not behave identically.
- Persistence and replication off. Almost every run above disabled snapshots or had no replica. Production rarely does.
- Latency at saturation. Peak ops/sec usually comes with latency you would not accept. A p99 at your real load is more useful.
- “Up to.” This is the best case among many tests, not the typical one.
A fair test you can run yourself
- Write the question first. For example: “At 150K ops/sec with our key sizes, what is p99.9, with AOF on and one replica?” Peak throughput is a secondary number.
- Use the same instance type for each server, in one zone, freshly started. Put the client on a separate and larger machine. Watch client CPU during every run.
- Record versions. Save
INFO serverfrom each server, the exact binary or image digest, the kernel, the instance type, and the full config. - Set threads deliberately. Try a few values of
io-threadsfor Redis and Valkey and ofproactor_threadsfor Dragonfly, all within the same core count. Record the setting next to the result. - Use production sizes. Sample values with
MEMORY USAGE, take the read and write mix fromINFO commandstats, and copy the key count. Use a skewed key pattern if you have hot keys. - Preload, then warm up. Fill the keyspace before measuring. Discard the first few minutes.
- Run long and repeat. Ten minutes or more, at least three runs. Report the median and the spread.
- Measure latency at your target rate, not only at saturation. Use
--rate-limitingin memtier to hold a fixed rate per connection. - Test your real pipeline depth, usually 1, plus the depth your client library really uses.
- Turn on what production uses. AOF or RDB, a replica attached, TLS if you use it. Trigger
BGSAVEonce during a run and watch latency and RSS. - Measure memory per key. After loading, divide
used_memoryand RSS by the key count. Note fragmentation. - Publish the method with the result, even if only inside your team.
An example preload and test with memtier_benchmark. Replace the address, sizes, and ratio with your own. The value sizes and weights below are placeholders, not a recommendation.
# Preload every key once
memtier_benchmark -s 10.0.1.20 -p 6379 --protocol=redis \
  --threads=4 --clients=10 --ratio=1:0 \
  --key-maximum=5000000 --key-pattern=P:P --requests=allkeys \
  --data-size-list=100:60,1024:30,8192:10 --hide-histogram

# Measured run: 10% writes, 90% reads, skewed keys, no pipelining
memtier_benchmark -s 10.0.1.20 -p 6379 --protocol=redis \
  --threads=8 --clients=25 --ratio=1:9 \
  --key-maximum=5000000 --key-pattern=G:G \
  --data-size-list=100:60,1024:30,8192:10 \
  --pipeline=1 --test-time=600 --run-count=3 \
  --distinct-client-seed --hide-histogram \
  --print-percentiles=50,99,99.9 \
  --json-out-file=run-01.json
Keep every flag the same across servers. Change one thing at a time.
What to practise this week
- Take one vendor figure quoted in your team and fill in the eleven-point checklist. Count the blanks.
- Pull
INFO commandstatsand sample 1,000 keys withMEMORY USAGEfrom a non-production copy. Write down your real read and write mix and value size spread. - Run the preload and one measured run against the server you use today. Record p50, p99, and p99.9 at your current peak rate.
- Repeat once with persistence and a replica switched on, as in production.
- Only then add a second candidate on the same instance type.
Next in this series
Speed is one part. The next notes move to operations across Redis, Valkey, and Dragonfly: persistence and snapshots, replication and failover, memory behaviour under load, and upgrades.
Sources
- Dragonfly README, benchmarks section: https://github.com/dragonflydb/dragonfly/blob/main/README.md
- Dragonfly benchmark documentation (vendor run, v1.15.0): https://www.dragonflydb.io/docs/getting-started/benchmark
- Dragonfly v1.15.0 release, 4 March 2024: https://github.com/dragonflydb/dragonfly/releases/tag/v1.15.0
- Dragonfly, “Dragonfly vs. Valkey Benchmark: 4.5x Higher Throughput on Google Cloud,” 4 March 2025: https://www.dragonflydb.io/blog/dragonfly-vs-valkey-benchmark-on-google-cloud
- Dragonfly, “Dragonfly Is Not Redis: An Open Letter to the Community,” 30 April 2025: https://www.dragonflydb.io/blog/dragonfly-is-not-redis-an-open-letter-to-the-community
- Redis, “13 Years Later, Does Redis Need a New Architecture?”, 28 June 2022: https://redis.io/blog/redis-architecture-13-years-later/
- Redis 8.0-M02, 4 November 2024: https://redis.io/blog/redis-8-0-m02-the-fastest-redis-ever/
- Redis 8.0-M03, 11 February 2025: https://redis.io/blog/redis-8-0-m03-is-out-even-more-performance-new-features/
- Redis 8 GA, 1 May 2025: https://redis.io/blog/redis-8-ga/
- Redis 8.2 GA, 8 August 2025: https://redis.io/blog/redis-82-ga/
- Redis 8.4 GA blog, 25 November 2025: https://redis.io/blog/redis-8-4-open-source-ga/
- Redis 8.4.0 release notes: https://github.com/redis/redis/blob/8.4.0/00-RELEASENOTES
- Valkey 8.0 RC1, 2 August 2024: https://valkey.io/blog/valkey-8-0-0-rc1/
- Valkey, “Unlock 1 Million RPS,” part 1, 5 August 2024: https://valkey.io/blog/unlock-one-million-rps/
- Valkey, “Unlock 1 Million RPS,” part 2, 13 September 2024: https://valkey.io/blog/unlock-one-million-rps-part2/
- Valkey, memory efficiency in Valkey 8, 4 September 2024: https://valkey.io/blog/valkey-memory-efficiency-8-0/
- Valkey 8.1 GA, 2 April 2025: https://valkey.io/blog/valkey-8-1-0-ga/
- Valkey, “Scaling a Valkey Cluster to 1 Billion Request per Second,” 20 October 2025: https://valkey.io/blog/1-billion-rps/
- Valkey 9.0, 21 October 2025: https://valkey.io/blog/introducing-valkey-9/
- Valkey, “Reducing Memory Overhead in Valkey 9.1,” 13 August 2026: https://valkey.io/blog/9.1-memory-efficiency/
- memtier_benchmark source and options: https://github.com/RedisLabs/memtier_benchmark
Releted Posts
Redis, Valkey, or Dragonfly: revisit the choice before you treat them as the same cache
If your service already uses Redis, the name on the port has not changed. The product behind that name has. Treating Redis, Valkey, and Dragonfly as three labels for one cache is the habit worth unlearning.
Read more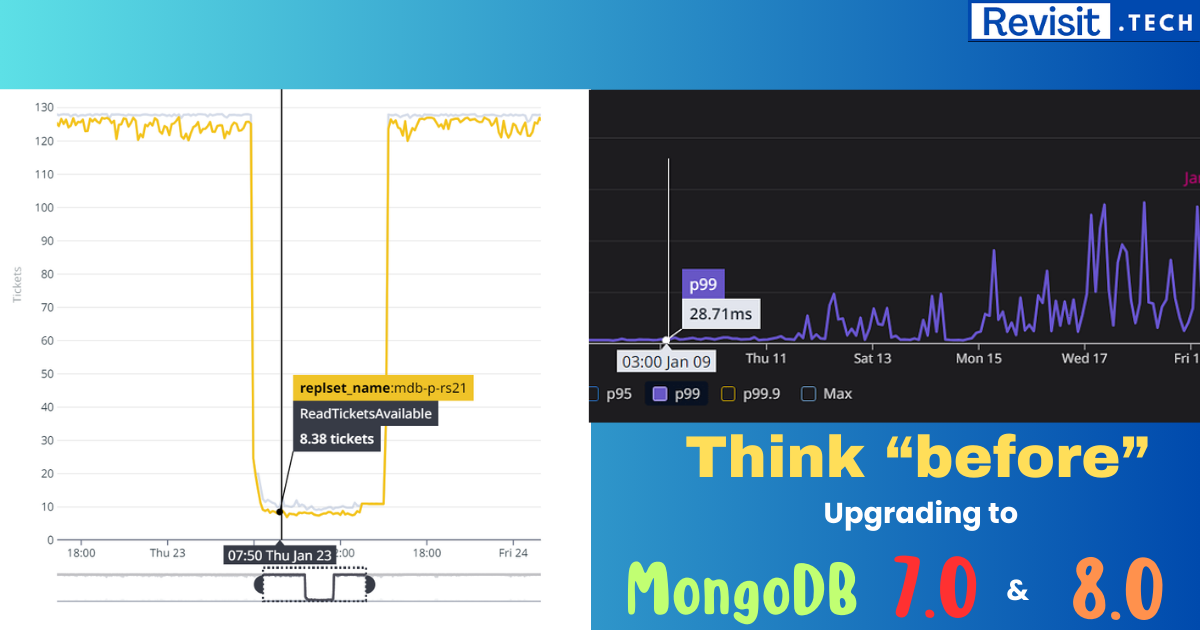
MongoDB 8.0 Performance is 36% higher, but there is a catch…
TLDR: If your app is performance critical, think twice, thrice before upgrading to MongoDB 7.0 and 8.0. Here is why…
Read more
How Redis Helps to Increase Service Performance in NodeJS
In modern backend applications, performance optimization is crucial for handling high traffic efficiently. Typically, a backend application consists of business logic and a database.
Read more